
Product Review: KMAX Network Emulator
Reviewed by Dan Nagle on 2020-05-05
I am very excited to get my hands on a KMAX-MM from IWL.com. I was given a unit in exchange for a thorough and honest review.
What problems does this product solve? Far too often developers only test their apps in perfect conditions. The app is developed using an i7 processor with 32 GB of RAM and with the database just one network hop away (or even better, running on localhost). As such, during development the app is blazing fast. To be clear, I do not fault this setup. You want your developers to have powerful tools. Hardware is cheap. Developers are expensive.
Unfortunately, when the app is finally delivered, conditions are no longer perfect. The database is now a cloud away. The network is much slower and often hostile. How is that video stream over 3G out in the boonies? What happens to the app when packets 1, 2, 3 actually arrive as 1, 1, 2, 2, 3? What happens when network degradation is sudden? Can the app handle this? Can the app recover afterwards?
I spent seven and a half years developing video streaming devices. Overcoming network performance issues is something very important to me. During this time, I would’ve loved to put some theories to the test. In comes a nifty little device from IWL.com called the KMAX. It is purpose-built to help answer these questions. They were gracious enough to send me one to test. In this review, I cover the aspects most important to me: Throughput, Latency, and Data Integrity. I also inspected the unit itself and its ease-of-use aspects.
Hardware
The KMAX-MM is an attractive little blue unit. It weighs maybe one pound and is thus highly portable. The case is metal, and I did not hear any fans spinning while powered on, making it quiet. It has a 12V AC power adapter that is rated to 2A, although I didn’t bother with an actual power test. Based on the specs from the adapter, I am already pleased with its low power use. Instead of an AC wall wart, power-over-ethernet would’ve been a nice feature.
Front view of the KMAX-MM

The KMAX goes in the middle of your network. Network impediments will occur between igb0 and igb1. There is a 3rd Ethernet port, igb2, used for management.
Back View of the KMAX-MM

The device took roughly 3 minutes to boot. I had no idea what network address it was assigned. I connected Wireshark to the management port and found the device’s network traffic was very quiet. My old trick of sniffing packets to find hidden IP addresses did not work for this unit. This is actually ideal for a network test device. I don’t want any traffic on my network that I did not command.
Upon boot, I did see a series of DHCP requests that eventually ended. What is the fallback address? I don’t know. This process ended again in total silence. I flipped over the box, and I saw… an IPv6 address! Interesting. Is this a new trend? Do we now default with DHCP to get an IPv4 address with a static IPv6 address for fallback? Sign me up! I punched in http://[IPv6 address]/ and landed on the KMAX-MM web page. I am in! That was easy. I then gave the KMAX a static IPv4 address to save it from attempting DHCP. Also, why would you not want your server on a static address?
Before beginning any of my tests, I wanted to see what kind of impediment was introduced by just having the KMAX unit installed. I performed throughput and latency tests with KMAX set to “dual bypass” and then again with no KMAX unit at all. I am happy to report that the KMAX unit itself introduced no impediments.
Throughput
In the past, whenever I wanted to test an app at a lower network speed, I would connect it to a 2.4 GHz wireless network and flood the network with packets from another computer. Yes, this was very crude and uncontrolled. Fortunately, I no longer need that kind of nonsense. The KMAX has a rate limiter. Quick tip for web developers: your browser has a rate limiter too! You can easily test your page loads with simulated slow connections. For Chrome, hit F12 and look at the “Performance” tab:
Chrome Speed Throttle

Say I’m developing a file transfer tool, and I want to see how it performs on slower networks. A smart transfer tool would negotiate to lower speeds and readjust when the speed improves. The Linux utility “cURL” is such a smart tool. For this, I put a Raspberry Pi on the other side of the KMAX with dual bypass for a baseline. I used curl to download my favorite operating system, Ubuntu’s latest LTS. Version 20.04 “Focal Fossa”, which just came out and is awesome.
ISO Download Dual-bypass

Raspberry Pi has horrible disk I/O performance, so I piped my output to /dev/null. 39.6M is my baseline. I then told KMAX to rate-limit the transfer to 10M. Let’s see the result.
ISO Download Rate-Limited

Perfect. It is hovering right around 1M (8 bits in a byte plus overhead). I toggled bypass on and off, and I could see curl’s metrics adjusting in real-time.
I am pleased with the KMAX rate-limiting feature. This test will be very useful.
Latency
Here is a test I am looking forward to. For real-time collaboration, latency is the utmost importance —more important than quality. People can easily tell the difference, within milliseconds, if the audio does not quite match the lips of talking heads on a screen.
It is common for AV streams to send audio to a different port and then mix it back into the video data (separating the 2 has other benefits too, like the ability to easily swap audio channels). What happens if there are delays between the two? I’d like to be able to test that.
For this test, I started two RTP video streams at the same time on different ports and unicast them to my Raspberry Pi video player. My video is a running stopwatch so I can easily see the delay.
Stopwatch No Delays

The video shows a 1.2 second difference between the two. That’s from the player’s buffer. This is fine for this test. The way this will work is the delay node inside the KMAX will fill a bucket of packets. Once full, it will start draining them.
I told KMAX to delay packets going to port 5005 (the video on the right) for 10 seconds and let everything else through. Let’s see the result.
Stopwatch 10s Delay

Carrying my initial 1.2 second gap from earlier shows I’ve added a 10 second delay. Nice! This will be very useful in my testing. As a bonus, I can click flush and see how it handles a sudden network pause as the KMAX refills the bucket.
Of course, there is a much easier way to test this, but it is nowhere near as fun. Here is a ping test with KMAX set to a 5 second delay on all packets.
Ping with 5s Delay

Adding 5 seconds to the other direction brought my total round-trip delay to 10s. Excellent. I’m pleased with KMAX’s latency test.
Data Integrity
We covered throughput and latency. As a developer of network protocols, I am also concerned about data integrity. I want accurate data while overcoming hostile networks. For these tests, I looked at KMAX’s duplication and alter nodes. I also used my favorite network test utility, Packet Sender. For this test, I told KMAX to corrupt packets going to port 5555. Let’s see the first test with corrupted packets over TCP.
TCP Stream

TCP’s built in error detection and retry system does a good job of discarding corrupted packets before they land in my app. The final text looks correct. However, Wireshark shows us the herculean effort under the hood.
Wireshark with Corrupted TCP

What a mess! KMAX did a good job corrupting the data.
For the duplication test, I switched to UDP. I wanted to actually see this…
Duplicated UDP

Perfect. Packet Sender does not discriminate between duplicates. I picked up 2 copies with 1 send. I want to be sure whatever protocol I am developing can handle that. Tip for protocol developers: sequence numbers are an easy fix for packet duplication.
Ease of Use
The device works, but is it easy to use? The web UI is built on top of Bootstrap. Millions of well-known websites use this framework, so navigating around was immediately familiar. All the controls were easy to find and tweak. The interface is clean. I never felt like I was fighting the UI to make it do what I needed.
Desktop Dashboard

However, on mobile devices it’s a different story. The UI is unusable on a phone. As an internal test tool, this is perfectly fine. I am trying to think of a scenario where I’d require my LAN-based network inhibitor to have a mobile UI, and I cannot think of one. If I do get desperate, mobile browsers allow switching to desktop view.
Mobile Dashboard

A tip for aspiring web developers: your desktop browser has a “mobile mode” designed to help mobile testing! In Chrome, hit F12, and then click “device toolbar” in the top left.
Automation
This feature came as a total surprise. The KMAX-MM supports a REST API for use in automation. It includes a sample python script to get you going quickly. The example script is built with python2, which is end-of-life as of 2020-04-20. Fortunately, python2 to python3 migration tools such as “2to3” are available. A quick command-line call and a couple of small touch-ups put me back in business. The script ran through a series of examples. It also had a couple of hardcoded Linux-specific file paths which caused it to break in Windows. Tip for Windows users (lots of tips in this review): check out “WSL”. It is a wonderful tool that lets you run native Linux utilities inside Windows 10. Switching to WSL solved the issue. I actually started with WSL and only switched to Windows python3 to see if the script was cross-platform compatible for this review.
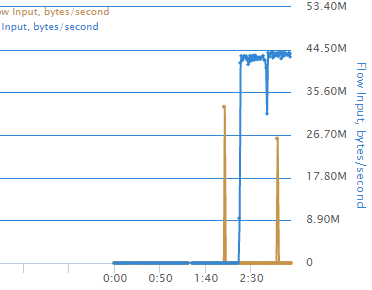
From somebody who has written web scraping utilities to achieve the same effect, simply having automation as an option built-in is very welcome. Here is an example from the charting system (KMAX supports many charts and tables). I captured my Ubuntu ISO file transfer test from earlier. It seems I’m hitting a little under 44M.
Transfer Graph
That is a nice chart. Do you know what impresses me even more than a pretty chart? Not having to look at a chart at all! I re-ran my test. Instead of looking at the chart, I captured the REST output for the stats. It took a bit of digging (the REST documentation is not great, but fortunately the sample python code is heavily commented —look there for your answers), I found the JSON output I was looking for:
{
  "id": "classifierBtoA",
  "statsInfo": {
    "hookStats": {
      "default": [
        168278,
        252212521,
        0,
        0
      ]
    },
    "timestamp": 2916.5173888131976
  }
}
I waited several seconds (6.48 to be exact) and then captured another REST output.
{
  "id": "classifierBtoA",
  "statsInfo": {
    "hookStats": {
      "default": [
        353326,
        532364190,
        0,
        0
      ],
    },
    "timestamp": 2922.9979112502187
  }
}
Those numbers are total packets and bytes at particular timestamps. Some quick math shows that my rate is 43M. It matches! This means I can make a fully-automated test! If this particular test interests you, the REST call I used was at /v1/Nodes/classifierBtoA?pp
Final Thoughts
The KMAX is a handy little device. I’ve already walked through several test scenarios that are immediately useful to me and more are already coming to my mind. In the past I had to cobble together my own network tests through writing custom test code, intentionally flooding my network, or other trickery. With the KMAX, I now have a dedicated unit to perform these tasks for me, and I can automate them too. That means better and faster results. I’m very pleased to have this device, and I believe it will make a good addition to your own test arsenal.
Dan Nagle
Author of Packet Sender
https://packetsender.com/